Cataloged Reflectance Curves
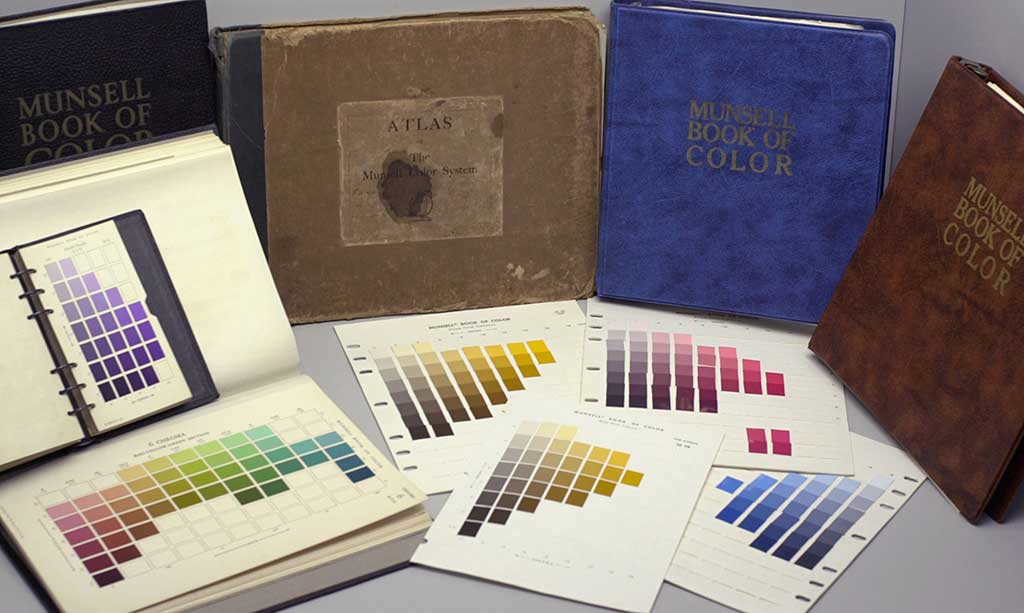
Various editions of the Munsell Book of Colors (By Mark Fairchild [CC BY-SA 3.0] via Wikimedia Commons)
One of the most widely available catalogs of reflectance curves comes from the Munsell Color System publications. This system describes object colors by hue, chroma (similar to saturation), and value (similar to brightness). Paul Centore published this web site, which has links to various catalogs of measured reflectance curves of the Munsell samples. In particular, I’ve found the data in this text file, which lists 1485 different Munsell colors, to be most useful in my studies. I’m assuming these measurements were made by Paul Centore. I’ve created an Excel spreadsheet for this data that may be more convenient than the text file version.
I’ve also added some columns to the spreadsheet containing sRGB values for each of the Munsell colors when viewed under D65 illumination, using the equations presented earlier. (Here is a text file of the sRGB values in case the Excel format is not handy. They are presented in the same order as the reflection curves in the previous text file and Excel file.) You might notice that some of the sRGB values fall outside the range 0 to 255. That is because these colors fall outside the sRGB gamut. This should not cause a problem since we are using good sRGB values to find a reflectance curve from this data, not sRGB values from a reflectance curve.
Suppose we have two sRGB colors we wish to mix subtractively. We can do this by finding the nearest Munsell color to each of these sRGB colors, and then mixing the corresponding reflectance curves. A little software is handy here. An exhaustive search could be performed by computing the distance between the given sRGB and each of the Munsell sRGB triplets (that is, 


 ), and then selecting the smallest distance. Or, in the Excel spreadsheet, a new column could be defined that computes this sum of squares, and then the rows could be sorted by this column to bring the smallest to the top. There are other more efficient algorithms for doing nearest-neighbor searches. In Matlab, I would generate a Delaunay triangulation of the sRGB Munsell values and then use the nearest neighbor function to operate on it.
The quality of the selection can be improved somewhat if we use a different color space. sRGB is not considered “perceptually uniform,” that is, equal movements in sRGB space do not represent equal changes in perceived color. In some parts of the space, large changes in color happen with small changes in sRGB values, and vice versa. The L*a*b* color space is more perceptually uniform. So it would be better to convert the sRGB values to L*a*b* values (by doing this, then this), and then compute the distances between the given L*a*b* triplet and the Munsell L*a*b* values.
It should be noted that the Munsell samples are intended to be viewed under Standard Illuminant C instead of D65. Illuminant C is intended to mimic northern sky daylight, whereas D65 mimics noon daylight. They are not far apart in color temperature: C is 6770 K and D65 is 6500 K. However, for our purposes, the intended viewing conditions are irrelevant. We are simply using the Munsell dataset as a source for reflectance curves corresponding to specified D65-referenced sRGB values. The hue/chroma/value designations of the Munsell samples are irrelevant. The Munsell set is simply providing us with a pool of reflectance curves that belong to real painted surfaces.
Once the Munsell reflectance curves most closely matching the sRGB colors being mixed are selected, then the reflectance curves can be mixed using the weighted geometric mean mixing rule presented earlier. The resulting reflectance curve can then be converted to sRGB to complete the mixing process. There is a possibility that the mixed curve will give an sRGB value outside the sRGB gamut (outside 0-255). In that case, I’d advise simply clipping the values to stay within 0 and 255.
This page describes the first of two potential ways to subtractively mix two sRGB colors. A better approach is presented on the next page.
Navigation
The presentation is spread over several web pages. Click the Next Page or Previous Page links to move sequentially. To access a page directly, use these links:
1. Introduction
2. Mathematics of Human Color Perception
3. Subtractive Mixture of Two Reflectance Curves
4. Cataloged Reflectance Curves (this page)
5. Computing Reflectance Curves Directly from sRGB Values