![]()
Published April 29, 2015 by Scott Allen Burns, last updated March 12, 2025
9/19/2017 Updated symbols to reflect common colormetric usage:
 instead of
  ,
,  instead of
  ,
,  instead of
  ,
,  instead of
  .
.9/20/2017 Added explicit formula for
 in LSS method.
9/26/2018 Added link to a fast reflectance reconstruction method.
10/2/2018 Changed
 matrix to be called
  , which matches established usage.
10/10/2018 Changed
 to the more correct non-italic form
  .
.10/18/2018 Added a line-by-line explanation of how to read the Matlab code for ILSS.
11/1/2018 Did some minor editing for clarification of some points.
5/23/2019 Added attribution to earlier work related to the LSS method. Added notice of upcoming publication in the Color Research and Application journal.
6/4/2019 Added new LHTSS (Least Hyperbolic Tangent Slope Squared) method that gives best quality reflectances of all six methods. It appears at the end of the article.
12/25/2019 Added link to short note on implementing the Rec.BT.2020 RGB primaries.
1/9/20 Added notifications in the body pointing out that LHTSS is a better option than ILLSS in general.
1/18/20 Added link to CR&A paper.
3/29/20 Added preface and reference to TLSS.
4/13/20 Updated the preface.
5/11/20 Corrected a typo in the F expression for the LHTSS method. (Thanks Marnix!)
5/15/20 Added links to Excel spreadsheets that implement the LLSS and LHTSS methods.
5/25/20 Added link to the Wiley Online Library for the CR&A journal paper.
5/26/21 Divided the web page into a series of pages for faster loading.
1/12/24 Added more explanation to the conversion from reflectance to rbg.
3/12/25 Added link to CRAA journal paper PDF.
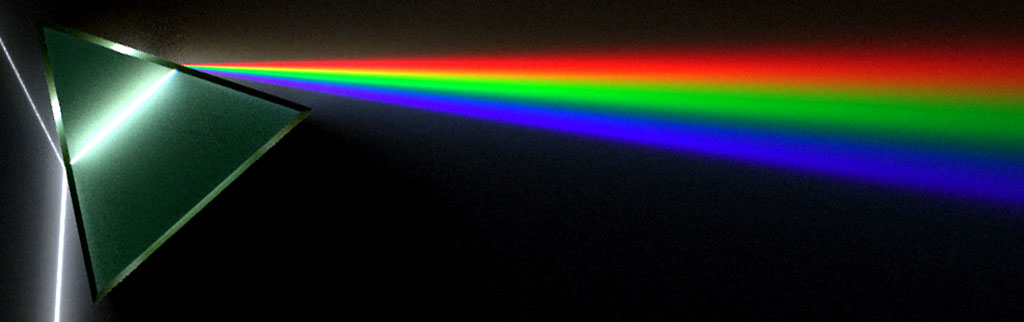
By Spigget [CC BY-SA 3.0], via Wikimedia Commons (edited)
Preface
A note to those working in the color science field: This presentation is aimed at a general audience and will cover much background material with which you are already familiar. A much more concise version of the methods presented below is available in the journal article “Numerical Methods for Smoothest Reflectance Reconstruction,” which has been published in Color Research and Application (Vol 45, No 1, 2020, pp 8-21, DOI: 10.1002/col.22437). A PDF of this journal article is available here: Numerical Methods for Smoothest Reflectance Reconstruction, Burns 2020. Additional development is also available online at the supplementary documentation web page that accompanies the CR&A paper. Note that the three methods presented in the journal paper (called simply methods 1, 2, and 3) correspond to the methods below called LSS, LLSS, and LHTSS, respectively.
Overview
I present several algorithms for generating a reflectance curve from a specified sRGB triplet, written for a general audience. Although there are an infinite number of reflectance curves that can give rise to the specific color sensation associated with an sRGB triplet, the algorithms presented here are designed to generate reflectance curves that are similar to those found with naturally occurring colored objects. My hypothesis is that the reflectance curve with the least sum of slope squared (or in the continuous case, the integral of the squared first derivative) will do this. After presenting the algorithms, I examine the quality of the computed reflectance curves compared to thousands of documented reflectance curves measured from paints and pigments available commercially or in nature. Being able to generate reflectance curves from three-dimensional color information is useful in computer graphics, particularly when modeling color transformations that are wavelength specific.
Introduction
There are many different 3D color space models, such as XYZ, RGB, HSV, L*a*b*, etc., and one thing they all have in common is that they require only three quantities to describe a unique color sensation. This reflects the “trichromatic” nature of human color perception. The space of color stimuli, however, is not three dimensional. To specify a unique color stimulus that enters the eye, the power level at every wavelength over the visible range (e.g., 380 nm to 730 nm) must be specified. Numerically, this is accomplished by discretizing the spectrum into narrow wavelength bands (e.g., 10 nm bands), and specifying the total power in each band. In the case of 10 nm bands between 380 and 730 nm, the space of color stimuli is 36 dimensional. As a result, there are many different color stimuli that give rise to the same color sensation (infinitely many, in fact).
For most color-related applications, the three-dimensional representation of color is efficient and appropriate. But it is sometimes necessary to have the full wavelength-based description of a color, for example, when modeling color transformations that are wavelength specific, such as dispersion or scattering of light, or the subtractive mixture of colors, for example, when mixing paints or illuminating colored objects with various illuminants. In fact, this web page was developed in support of another page on this site, concerning how to compute the RGB color produced by subtractive mixture of two RGB colors.
I present several algorithms for converting a three-dimensional color specifier (sRGB) into a wavelength-based color specifier, expressed in the form of a reflectance curve. When quantifying object colors, the reflectance curve describes the fraction of light that is reflected from the object by wavelength, across the visible spectrum. This provides a convenient, dimensionless color specification, a curve that varies between zero and one (although fluorescent objects can have reflectance values >1). The motivating idea behind these algorithms is that the one reflectance curve that has the least sum of slope squared (integral of the first derivative squared, in the continuous case) seems to match reasonably well the reflectance curves measured from real paints and pigments available commercially and in nature. After presenting the algorithms, I compare the computed reflectance curves to thousands of documented reflectance measurements of paints and pigments to demonstrate the quality of the match.
Navigation
The presentation is spread over several web pages. Click the Next Page or Previous Page links to move sequentially. To access a page directly, use these links:
1. Introduction (this page)
2. Computing an sRGB triplet from a Reflectance Curve
3. Linear Least Squares (LLS) Method
4. Least Slope Squared (LSS) Method
5. Least Log Slope Squared (LLSS) Method
6. Iterative Least Log Slope Squared (ILLSS) Method
7. Iterative Least Slope Squared (ILSS) Method
8. Comparison of Methods
9. Conclusions (pre-6/4/19)
10. Update 6/4/19: Least Hyperbolic Tangent Slope Squared (LHTSS) Method
It would be awesome if you could provide a bit more detail on using other colorspaces and light sources. I can’t quite figure out how I would modify the program to use Adobe RGB, for instance, which uses a normal 2.4 gamma instead of the funky sRGB. Ultimately it should be possible to use an ICC profile to get the RGB working space. Then you could paint in a space that exactly matches your calibrated/profiled monitor.
I do mention that at the end of the companion article on subtractive mixture. It’s really pretty simple. This website:
http://www.brucelindbloom.com/index.html?Eqn_RGB_XYZ_Matrix.html
outlines the changes you would make to the M matrix for AdobeRGB and other RGB types. This would then be used to compute a new T matrix. See the “more details” drop-downs on that page for, uh, more details!
You’re right, it’s all there. I was looking for the w normalizing factor on Bruce’s site, totally missed your description of how that is calculated. Sorry about that!
I’m having trouble wrapping my brain around alpha channel. Do you know if there is a fundamental issue with dealing with transparent paints using this technique? It seems that when I ignore the alpha channel blend with pure alpha areas on the canvas, then it’s behaving like I’m blending with white paint. If I premulitply the RGB triplet with the alpha value, then it’s like mixing with a black or darker paint. I’m wondering if the whole concept of alpha channel only works for light/additive model?
I really don’t know much about alpha channel blending. Out of curiosity I found this page that might answer some questions:
https://en.wikipedia.org/wiki/Alpha_compositing
Darn, but thanks. I’ve been looking at that and a few other sites and haven’t figured it out yet, but I’m almost sure it will need to use a different technique. If any color is totally or partially transparent, maybe I can use those opacity values within the WGM mixing. So, if I mix two paints at a 1:1 ratio, but paint A is 100% opaque and paint B is 50% opaque, then the WGM ratio should be modified to be 3:1 and the overall alpha level of 75% would be applied to the resulting RGB. Maybe. . . I’ll give it a shot and let you know.
I meant, 2:1, not 3:1…
I think I figured it out, seems to work really well. Basically the idea is that if a paint is 50% opaque, we can treat it as 50% less paint and adjust the ratio. I’m sure that’s a crude approximation to actual diluted paint, but it gets the job done maybe. Here’s a spreadsheet with the formula I came up with:
https://docs.google.com/spreadsheets/d/1xOPfDzAA7kzHRaxPX05GFRky19mXdQFLD5CDDtCcioU/edit?usp=sharing
I’m sure it can be simplified. I just had to add some checks to avoid div/0
Hi Scott. This recent publication seems to confirm the method I arrived at for handling alpha. Basically treating alpha as the ratio for the weighted geometric mean, scaled to sum to 1.0:
https://hal.archives-ouvertes.fr/hal-01700606/document
Also, I’ve made some more progress that makes your algorithm much more convenient. Instead of calculating a new SPD for each individual color, I’ve just generated 3 spectral primary curves for R, G and B. Then whenever I mix two colors I upscale the RGB to the spectral curves, sum those 3 curves into one unique spectral curve for each color. Then I mix as you’ve demonstrated with the weighted geometric mean and convert back to RGB. It seems to work really well! I made a thread here where you can download the program too:
https://community.mypaint.org/t/smudge-tweaks-testers-needed/1202/
Incredible work on your part. Really impressive. I’m working on implementing your ILLSS algorithm in JavaScript inside an upcoming color library, so it can be used by web developers.
Thanks for your interest! You might find this latest work to be of interest as well: http://scottburns.us/fast-rgb-to-spectrum-conversion-for-reflectances/
Hi,
For the LHTSS method their seems to be a typo either in the matlab or webpage.
In matlab d0 = (tanh(z)+1/2) (which is rho I believe)
This d0 is then used in the F vector but in on the web page it shows that to be diag(sech(z)^2/2. I believe the webpage is correct
Hi Marnix,
Wow, thanks for catching the inconsistency! The mistake is in the webpage; the Matlab code is right. The second term in the F vector should be T (tanh(z)+1)/2 – rgb. This is simply a restatement of the constraint expression in the optimization. I’ve updated the webpage with the correction. Many thanks for catching the problem!
Scott
Great. A question if I may. If I want to start from XYZ values instead of sRGB then I just remove the M matrix from the T and continue with that “new” T and of course use XYZ values instead of linearized RGB values further in the math.
SP the “new” T would be equal to A’ diag(W)/w
Yes, using XYZ instaed of sRGB is quite straightforward. I’ve emailed you the journal paper that grew out of this webpage as an attachment (Burns SA. Numerical methods for smoothest reflectance reconstruction. Color Res Appl. 2020;45(1):8-21). Please feel free to contact me for further discussion if you wish.
Scott thanks for sharing your computations in a spreadsheet…I was messing around with the LHTSS calculations and I wanted to adapt them to D50 illuminant but I could not understand where or how you derived the CMF coefficients for xbar ybar and zbar at the bottom…is this from a chart or calculation??
Hi Todd, Yes, the conversion from RGB to reflectance can be done with Illuminant D50, but be aware that you will not be working with sRGB anymore, as it is specifically referenced to D65. To start with a D50-referenced RGB, you would have to change not only the illuminant-referenced color matching functions (“CMFs” in cells B49 to AK51 in the spreadsheet), but also the rgb-to-XYZ 3×3 matrix (cells J9 to L11 in the spreadsheet) and the XYZ-to-rgb 3×3 matrix (cells J14 to L16). To change the CMFs matrix to be D50 referenced, you would multiply the un-referenced CMFs (http://scottburns.us/wp-content/uploads/2015/03/CIE-1931-2-deg-CMFs-10-nm.txt) by a square matrix with the D50 illuminant on the main diagonal (called diag(W) above) and then divide by the scalar product of the second row of A’ and D50 (called w above). The rgb-to-XYZ and XYZ-to-rgb matrices would be computed according to Bruce Lindbloom’s webpage using D50 instead of D65 (http://www.brucelindbloom.com/index.html?Eqn_RGB_XYZ_Matrix.html). Regarding the “companding” or “gamma correction” that is part of the rgb-to-sRGB standard (http://www.brucelindbloom.com/index.html?Eqn_RGB_to_XYZ.html), you would need to research whether or not there is a similar conversion standard in the D50-referenced color space that you are using.
Sometimes an approximate approach is used to convert from one reference illuminant to another, called “adaptation.” A 3×3 matrix, called a chromatic adaptation transform (CAT), is used in the conversion process. Keep in mind that this is only an approximation. You can find more on this here: http://www.brucelindbloom.com/index.html?ChromAdaptEval.html.
Hi Scott, thanks for this incredible resource. I am trying to run your Matlab code for LHTSS in an online Matlab compiler, and getting some singular matrix errors.
Here is the code, and I am using the same T and sRGB data as in your LHTSS Excel sheet, see the exact code here:
https://gist.github.com/mattdesl/c487605c5ea9d4eff1d494cf890575da
When I run this through an online Octave compiler (https://rextester.com/l/octave_online_compiler) I get a “warning: matrix singular to machine precision” with each iteration until it finally reaches the max iterations without being able to solve. Any ideas what I may be doing wrong?
Hi Matt,
I checked your code, and found that the T matrix you specified is different than the one I published on this page. When I run your code with my T matrix, your code works.
Scott